

“Can you de-trend crypto data?”
“?”
“I don’t mean ‘Are you personally capable of it?’ I mean ‘Is it something that makes philosophical sense to do?’”
De-trending, if you’re not a stats guy, means turning a diagonal line into a more or less horizontal one. Often a particular dataset will have a long term upwards or downwards trajectory, but will oscillate around this. If you’re more interested in the oscillations than the general trend, then the trend will screw with your calculations. To prevent this from happening, you can de-trend the data by differencing: that is to say, you subtract the second-to-last value you’ve got from the last value, and so on, and plot the result. If you’re lucky, this will produce a dataset whose average value is zero. (If you’re unlucky the trend itself will also change over time and so repeated differencing will be necessary to force your curve to lie flat, but you get the general idea.)

But why is this important?
We first got interested in the feasibility of de-trending crypto data when we were trying to find a use for some sentiment analysis systems we’d made. These take a quick-and-dirty approach to the problem, generating lists of words associated with positive and negative sentiment from an uploaded text, then letting the user tweak the lists by hand until they produce the outputs he wants. This approach - while unsophisticated - can out-perform much more advanced ones when dealing with domain-specific datasets. Something like Google sentiment is designed to be all things to all men, and won’t necessarily realise that - to pick an example we’ve worked on before - words like “apes” and “retarded” have a positive connotation on /r/wallstreetbets, though a negative one elsewhere. If you’ve got a dumb model like ours, however, you can just add these words in by hand and you’re away to the races, without having to train a whole new AI from scratch.
The result is something that is more accurate than Google when it comes to interpreting the sentiment underlying such highly specific datasets. We’ve already used this approach to extract stock tips from /r/wallstreetbets (see link above), and we were interested in seeing whether it would also work for to establish a relationship between unstructured sentiment data (Cryptopanic headlines, for example, or tweets) and prices.

It did, and now we’re Bitcoin billionaires, later virgins.
Just kidding. The problem, of course, is that finding a correlation between one day’s sentiment and the next day’s 8am prices simply tells you that your sentiment model is giving a relatively good representation of what’s going on right now. It doesn’t tell you anything about the general trend, and that is what you need to know about if you want to make sensible buying and selling decisions.
In fact, if you try to use the raw sentiment data for day trading you’ll almost certainly lose money (we tested it). There are a few extra steps that are required to make the sentiment signals useful, hence the reflections on the possibility of de-trending crypto data with which this article began.
In fact, while the question of de-trending crypto data is an important one (and will come up again later), an even bigger difficulty lies in pinning down the precise causal relationship between sentiment and price. The two variables are so strongly interconnected that it is almost impossible to work out whether a given change in sentiment caused or was caused by a corresponding change in price.
There are a few different methods that can be used to try to clarify things, and we ran through them in turn.
Normally, if you want to work out whether phenomenon X causes phenomenon Y or vice versa, you’d try to pinpoint which of them came first, and if you were a statistician you’d do this via a Granger causality test[1]. This checks whether past values of X have a statistically significant relationship with future values of Y. You can see an example of Granger causality here. Series X can be used to predict series Y, while Y cannot be used to predict X. Therefore, X must precede and cause Y.

The problem with this approach is that when it comes to cryptocurrency, neither sentiment nor price came first; they oscillate together and always have done - the causality runs in both directions, so trying to identify a first mover is a futile exercise.
Next please.
If you’ve flamed out in your attempt to attribute Granger causality, then your next option is to try phase space reconstruction, and here’s where the maths gets really juicy.

This method is used (among other things) for analysing datasets where variables affect one another simultaneously, with no temporal precedence. The example par excellence of this is the Lotka Volterra predator–prey model, which describes the way in which predator and prey populations vary together. As the number of prey increases they are able to sustain a greater number of predators, who then reduce the prey population and decline as a consequence of their own depredations.

This creates a system that can be represented in terms of a “basin of attraction” (an imaginary space capable of containing every possible action on the part of the phenomena involved) and an “attractor” (the part of the basin of attraction that represents their usual behaviour)[2].

In this context, phenomenon A can be said to cause phenomenon B if - somewhat counterintuitively - B can be used to predict A’s position (and vice versa). This frees us from the need to depend upon temporal precedence, allowing us to rely solely upon the relative positions of each variable. It’s a very interesting branch of maths, and the Wikipedia article is less incomprehensible than most in the field, if you want to check it out. It’s one of those phenomena that you learn about and immediately start to see examples of everywhere.
Unfortunately, however, this approach only works for systems that follow relatively reliable overall patterns. Cryptocurrency prices are (as far as we can tell) stochastic while average sentiment tends to hover around zero, meaning that if we assume there to be some relationship between sentiment and price the two variables will relate to each other in predictable ways, but do so unpredictable places. Sentiment and price of a given currency will oscillate around one another whether the price is $1,000 or $10,000, but the vast difference in possible prices makes the process extremely difficult to plot in a comprehensible manner - the potential basin of attraction could be almost infinite.
We could try to fix this by de-trending the data - per the opening paragraph - but the effect of Bitcoin halving cycles (the drop in mining rewards that happens every 210,000 blocks and pushes prices up) on overall crypto prices makes this difficult to do with confidence: what is a trend and what is halving-related seasonality? Alternatively, we could alter our measurement of sentiment to reflect not just the average direction in a given day, but the number of people expressing said sentiment, which would likely produce a stochastic time series that cointegrates nicely with price. This, however, would also require a monumental data-cleaning effort given that we would need to use Twitter to estimate the number of opinion-havers, and crypto Twitter is notoriously overrun with spam bots.
Fortunately, there may be a better way.
In 2018 an extremely interesting paper was published in Nature, detailing a way to separate out causal relationships without relying upon temporal precedence or deterministic attractors[3]. The theory behind the authors’ approach is pretty abstract but it relies on our a priori assumption that the two datasets are covariant in some way - that is to say that the movement of each tells us something about the movement of the other (but not necessarily anything else). We do not know whether, for example, Ethereum will be worth $1,000 or $10,000 in six months, but we assume that when it gets there sentiment and price will be oscillating around one another in a familiar manner.
The authors of the paper note that it is possible to split just such an oscillating dataset into a series of trends and oscillations around these trends. Like this:
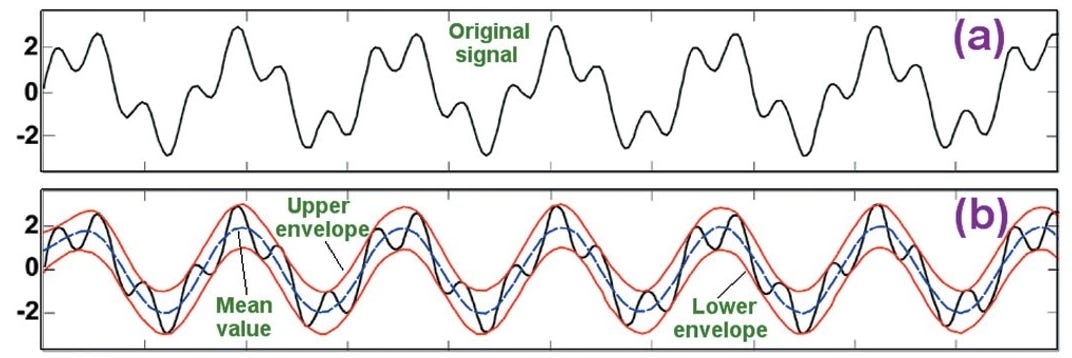
There’s a nice clear explanation of how the method works here, courtesy of Muhammad Ryan, but there’s no need to understand the details for the purposes of this example. The result is a series of curves (“intrinsic mode functions” or IMFs) that describe the short, medium and long term oscillations of the two datasets.
From this point, it is not just possible to work out the relative causal effect of each dataset upon the other, but to do it over a variety of time periods.
To do this, we first calculate the coherence (similarity) of the initial datasets. Then we decompose one of them into its component IMFs, remove one, recompose them, and recalculate the coherence between the two datasets. If the coherence drops, then the relationship described by the curve we removed is a causal one, and the more it drops the bigger the causal effect it has.
Such approaches to signal decomposition are used most frequently in the natural sciences and this specific approach has been demonstrated to work for analysing predator-prey relationships as described above, but also brainwaves, gait and climate data. Will it work for something as abstract and tech-mediated as crypto prices?
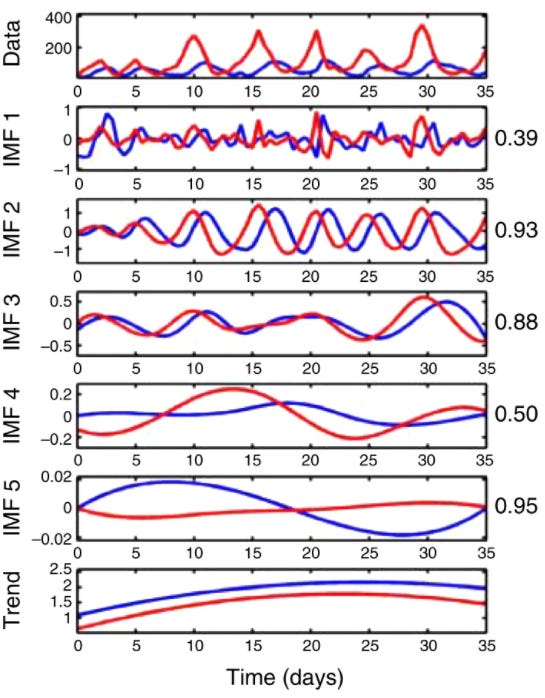
Apparently yes. Here, for example, is a decomposition of $BTC price and sentiment data over a few months in 2021/2022:

While the effect is weaker than in the predator-prey relationships described above, removing the IMF4 curve has a significant effect on the overall phase coherence. While price (blue) drives sentiment (red) in the short term, if we look at a roughly 30-day time horizon, sentiment becomes a stronger driver of price.

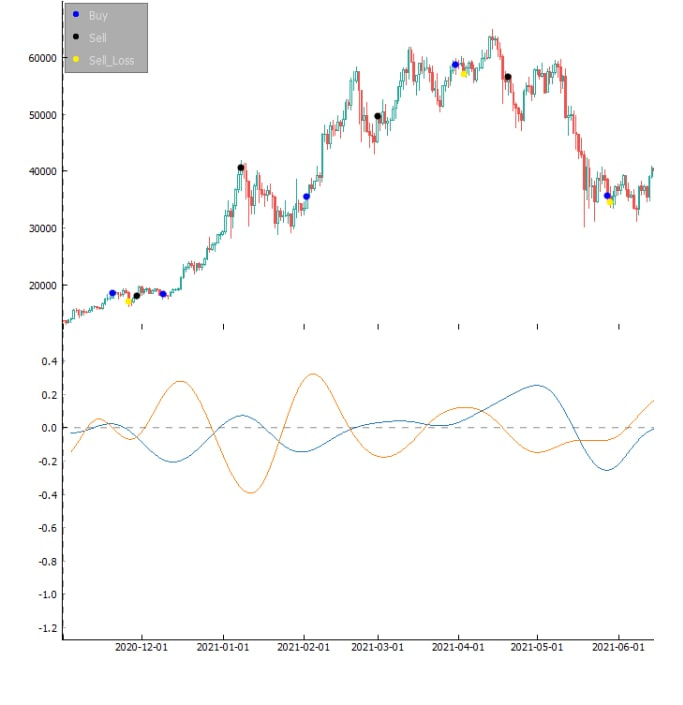
And that’s not all. Because the wavelength is so regular, we can use crosses to predict inflection points. If the two curves cross, we know that both sentiment and price of $BTC will probably change direction in about 15-20 days.

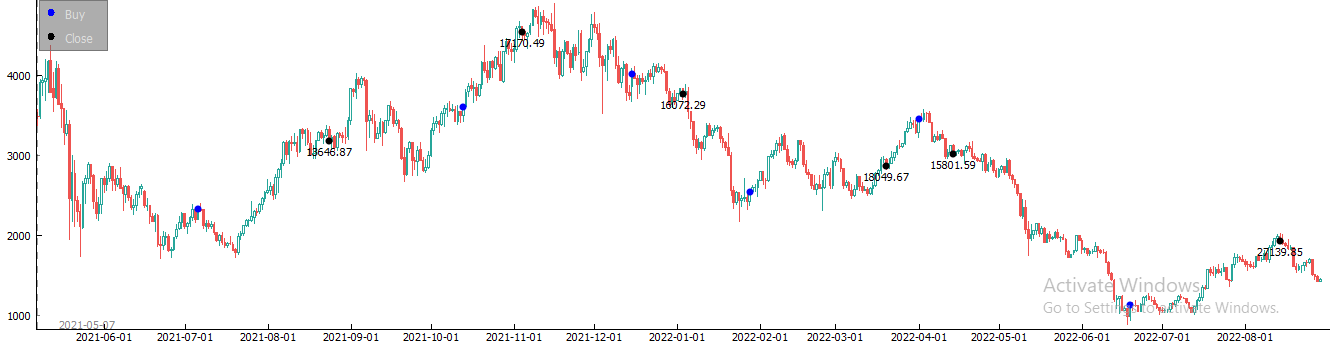
It’s not always spot on - the overall model is a little over-enthusiastic about hodling, but we can fix that with a stop-loss provision:
If we had been trading Ethereum using our model and a starting stake of $10,000 for the past year or so, we would have come out of it with $27,140. (For comparison, over the same period a buy-and-hold strategy would have left us with just $4,162.)
This, however, raises another question: Why do sentiment and price show such a regular pattern? And, while we’re at it, why is it the opposite of the pattern you’d expect? The sentiment and price curves are almost mirror images of one another, with the peaks of the sentiment curve occurring a day or two after the troughs of the price curve. Are crypto-traders just masochists (possible), or is something else going on here?
When looking at sentiment signals in a conventional stock trading perspective, one would expect to see an trigger event - say, the release of a new product or the ratification of favourable regulations - cause an increase in sentiment towards that company/stock, which would then cause a price rise. This price rise would generate more positive sentiment, leading to a cycle of positive reinforcement until either the market has bought as much of the stock as it can absorb or a negative trigger occurs to invert the trends.
In fact, the mirror image curves can be explained relatively easily. Cryptocurrencies are highly speculative assets, so as soon as the price begins to rise, online “experts” will begin to predict that the top is coming, while any drop will provoke exhortations to buy the dip. These grow in intensity and frequency until the market finishes by talking itself into a top or a bottom and the cycle begins again.
However, this still does not explain the regularity of the waveforms. Unlike in the conventional stock trading example given above, this cannot be a pure product of internal or external triggers. If positive and negative crypto shocks occurred with alternating regularity every 15-20 days someone would have noticed by now[6]. Without any outside explanation, there is only one possible conclusion: cryptocurrencies, it appears, have biorhythms.
So what drives them?
We suggest that sentiment and price are, in fact, tracking a third, invisible variable. Consider this image of the solar system as it travels through space:

If we removed the sun from the image, devising a model to account for the movements of the other planets would be incredibly difficult. With the sun in place, however, the mechanics of the system become obvious to any observer.
We suggest that both sentiment and price are being driven by a reliable third variable: trader stamina. Put simply, people can only keep it up for so long. If price and media warnings about a forthcoming top have been rising for long enough, traders begin to believe them. Under such circumstances, they are liable to seize upon a drop that would have been a mere blip earlier in the cycle, decide that it is indicative of a change in the longer term trend, and sell their holdings, thus making the market’s prophecy a self-fulfilling one. The same effect applies in reverse when price is falling and media is urging traders to buy the dip: after long enough people will seize upon any brief uptick in prices and transform it into a rally through pure belief. This explains why price tends to hit its maxima and minima a little before sentiment: every inflection begins life as a short term wobble that would be insignificant at any other point in the cycle, but the the market, desperate for change, seizes upon it and amplifies it. The wobble may have another proximate trigger - a drop in gold prices or a new crypto tax, for example - but this is not the cause of the change, merely the pretext. It would not provoke any long term shift in behaviour if traders were not already searching for an excuse to alter their behaviour.
Crypto sentiment-price cycles last 30-40 days because that is the length of time we can sustain them, and there is no other reasonable explanation.
Update as of 5th November 2023: We began trading using this strategy in October 2022, using a multisig wallet with around USD 7200 in. It’s not a precise test (we missed a couple of cycles on account of bugs in Uniswap’s Gnosis app), but you can track our progress here: https://app.safe.global/transactions/history?safe=eth:0xdC197fE667086478f8B93c679f9e8C717Dad7b33 We also switched to a specially trained BERT model a couple of months ago, when neural net based sentiment models finally edged past our basic bag of words for crypto-specific data.
[1] Yes, this should be “predicts” since the concept of causality has difficult philosophical implications, but everyone understands what’s being got at here.
[2] Diagram borrowed from Ng Sook Kien: http://ece-research.unm.edu/chaouki/PAPERS/Journals/CSM-Delay-NIculescu/References/Takens-results/seminar-takens.pdf
[3] Yang, Albert C., Chung-Kang Peng, and Norden E. Huang. "Causal decomposition in the mutual causation system." Nature communications 9, no. 1 (2018): 1-10.
[4] We also checked whether they follow lunar cycles. They do not.