The Book of Songs, one of the oldest works of Chinese literature, is traditionally supposed to have been compiled as an opinion-polling exercise. The royal court would send out bureaucrats to note down what folk songs were popular at a given time as a way of measuring popular sentiment. Early this year, we repeated the exercise in a more modern format, aiming to work out whether popular songs are - in fact - a good reflection of sentiment:
Here are our findings, given by question.
Descriptive Statistics
Obviously there is a degree of overlap between the jobs listed here, and everyone taking the survey was - to some degree - a gig worker. Nevertheless, it remains interesting to see how people choose to define themselves.
Religion
The slices too small to label here are Judaism, Taoism, animism and Shinto. The intensity chart is pretty interesting, and probably as reflective of the narratives people tell themselves as of devotion. Three and five are both reasonable-seeming expressions of moderate belief - four makes it sound like you believe and are simply too lazy to do anything about it. Likewise, an answer of eight or nine raises so many internal questions that it is easier just to jump straight to ten or self-flagellate at in the mid ranks. Thus one question produces two fascinating little non-linearities.
The Main Reason for the Survey: Songs
We asked two questions in this section:
What song have you thought about/found yourself singing most over the past few months?
What is your favourite song?
The aim here was to have another song set to compare against current earworms, to attempt to work out whether trends are reflected more in the former than the latter.
Each set of responses was then visualised using OpenAI’s embeddings plus Tensorflow Projector. This basically means that I asked OpenAI to generate a numerical representation of the semantic/coneptual distance between every answer and then visualised those distances in a 3D space.
You can see clear clusters: Christian, Indian, 2010s female vocals, people who only gave genres, people who gave no answer etc. However, some clusters also seem semantics or sentiment-based. If you use the right-hand panel to search for “parting glass” you can identify that its nearest neighbours include glass- and departure-related titles but also songs that simply embody a similar mood/sentiment. (Why, if these are closest together, do they appear far apart? Because we are trying to display a high-dimensional phenomenon in a 3D space. Try rotating the image a to see different angles.)
These seemed more religious and more upbeat in general, which may confirm the utility of the Zhou technique of studying currently popular songs as a measure of sentiment rather than all-time classics. The former reflect more of a person’s situation, the latter their fundamental qualities. The degree to which you feel each song list reflects the current zeitgeist is relatively subjective, however.
Politics
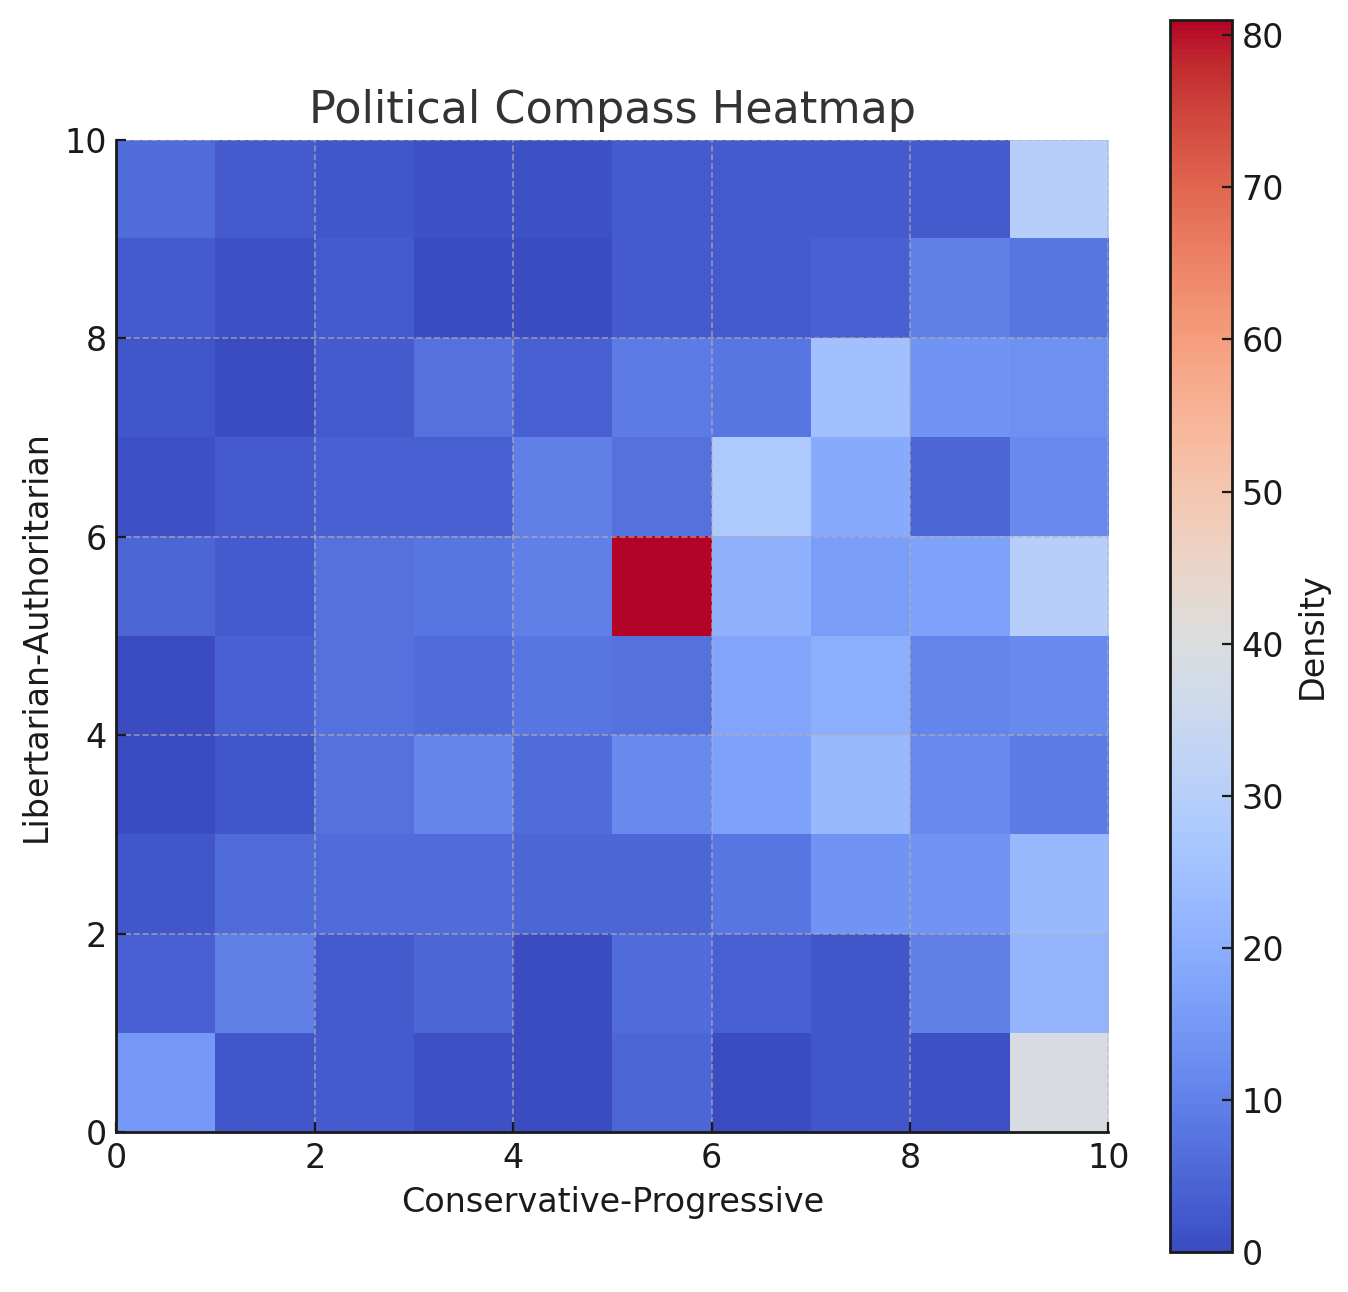
Our sample skewed progressive, but it is worth noting that the definition of “progressive” is different in India and the US, to pick just one example. This may also be an artifact of the age skew shown above. Interestingly, however, when questioned on specific issues, a clear preference for a more classical liberal state emerged, with respondents prioritising security and being opposed to economic interventionism.
Despite this, however many of the most popular leaders were relatively conservative/authoritarian.
If you could pick anyone to be your next President/Prime Minister/Sovereign, whom would you pick? https://projector.tensorflow.org/?config=https://gist.githubusercontent.com/JenD86/7886d89468b5cf2dd076f698a6f99ec0/raw/4b565731007c9f9bbb80c998b0ff200b2ecc38b6/sovereign.json
Once again we can see multiple factors going into the clustering here: Trump is bundled in with other Americans, but also with individuals have similar attitudes and styles like Narendra Modi and Rodrigo Duterte.
This can lead to some interesting artifacts:
When it came to the selection methods for politicians, however, our sample was more conventional, so my dreams of a combat/sortition based procedure will probably not be realised any time soon:
Tea Preferences
This was a question from Twitter, and unfortunately I have lost the records of who asked it.
Venting
Another Twitter question:
In this section we also asked how effective people found their venting. This is harder to display visually, but contained some interesting data. On the face of it things seem clear: if we do an ordinal logistic regression of venting frequency on perceived effectiveness we get a coefficient of 0.237 with a p-value of < 0.001, so this is a significant positive effect. Clearly the more effective you find venting the more often you do it. But wait. How about if we do the same regression in the other direction? It turns out we get an even bigger positive correlation: 0.301. So which is causing which? It’s not easy to work out without time series data, but we can do a likelihood ratio test. Results:
Model 1 (Venting → Perceived Helpfulness): AIC=1959.00
Model 2 (Perceived Helpfulness → Venting): AIC=2046.15
Turns out neither of them is actually a good predictor of the other.
Actually, this is kind of hinted by the original signs and p-values, which seem to suggest a non-linear relationship here. It seems like bad experiences with venting disincline people to try it again, while good experiences encourage more.
We can check this by visualising the probabilities:
It’s not perfect because, like a moron, I made one of these a five-point ordinal scale and the other four-point, and I am too lazy to apply rigorous methods to fix this now, but you can still clearly see the relationship. If you’re not familiar with the method, what’s being displayed here is basically the probability you chose x having chosen y and vice versa. If you declare venting is unhelpful you are less likely to do it often, and if you do it less often you are less likely to declare it helpful. Likewise if you declare it helpful you are more likely to do it often, while if you do it often you are more likely to find it helpful.
Books
One Twitter user asked for esoteric book recommendations: “What is one written work (book, article, essay, poem etc.) you have read that, to the best of your knowledge, no one you know has also read?”
Interestingly, the responses to this question clustered far more strongly than the songs. Self-help volumes predominated, with Rich Dad, Poor Dad being the clear victor.
If you have pubic hair, what do you do with it?
Obviously this was Twitter.
Interestingly, while there was no difference between public and private sector workers’ preferences, bureaucrats were less forthcoming.
Also:
Esoterica
Another Twitter question:
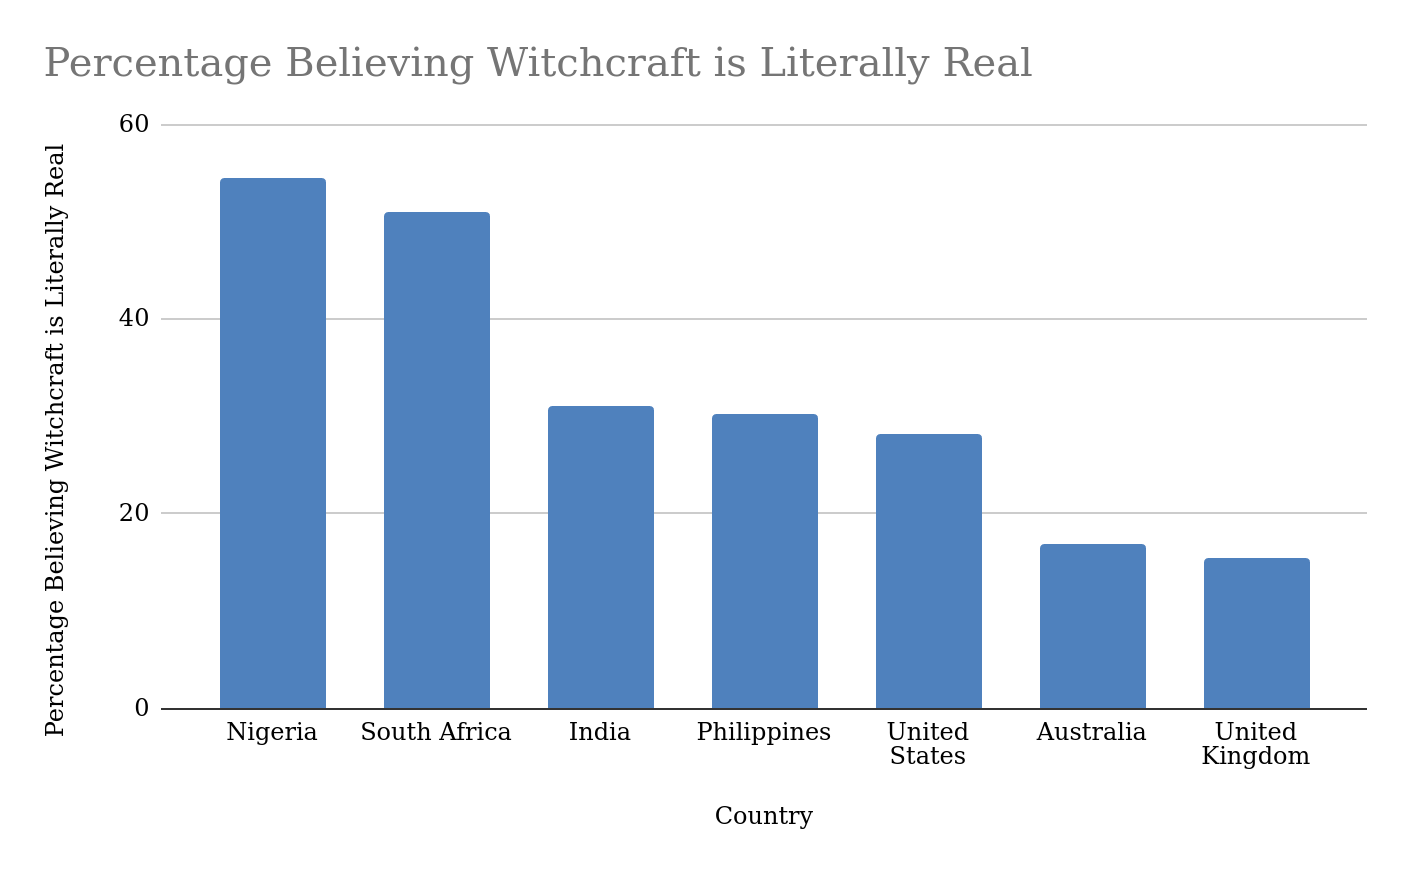
While, unsurprisingly, Nigeria had the highest proportion of respondents who believed in the literal reality of witchcraft, 15% of UK respondents shared the same belief.
Also interesting: far fewer people believed in cryptids and UFOs than in the soul or human virtue, despite (or possibly because of) the overwhelming preponderance of evidence in favour of the former. Possibly this is simply a reflection of the fact that if a cryptid or a flying object is identified it ceases to be a cryptid/UFO.
Jailtime
We asked two questions to assess respondents’ time/money preferences:
What is the minimum amount of money (USD) you would need to be offered to do a year in jail? If you wouldn't do it for any amount of money, just write in "na".
What is the minimum amount of money (USD) you would need to be offered to do five years in jail? If you wouldn't do it for any amount of money, just write in "na".
The range of values for each was obviously extreme - some people chose to write 1 and then hold down the 0 button to express a strong disinclination to do jailtime. This section thus needed the most cleaning. As well as removing extreme outliers, I also took out any lines in which a respondent seemed willing to do five years for less money than one. The result of all this was:
One year:
Mean: $1,557,126.59
Median: $175,000
Five years:
Mean: $32,128,057.61
Median: $1,000,000
Predictions
I was a little surprised by how pessimistic people are about superconductors. Maybe this was just down to a comparative lack of familiarity with the sector, however. Once again, aliens get surprisingly little love.
Anything Else?
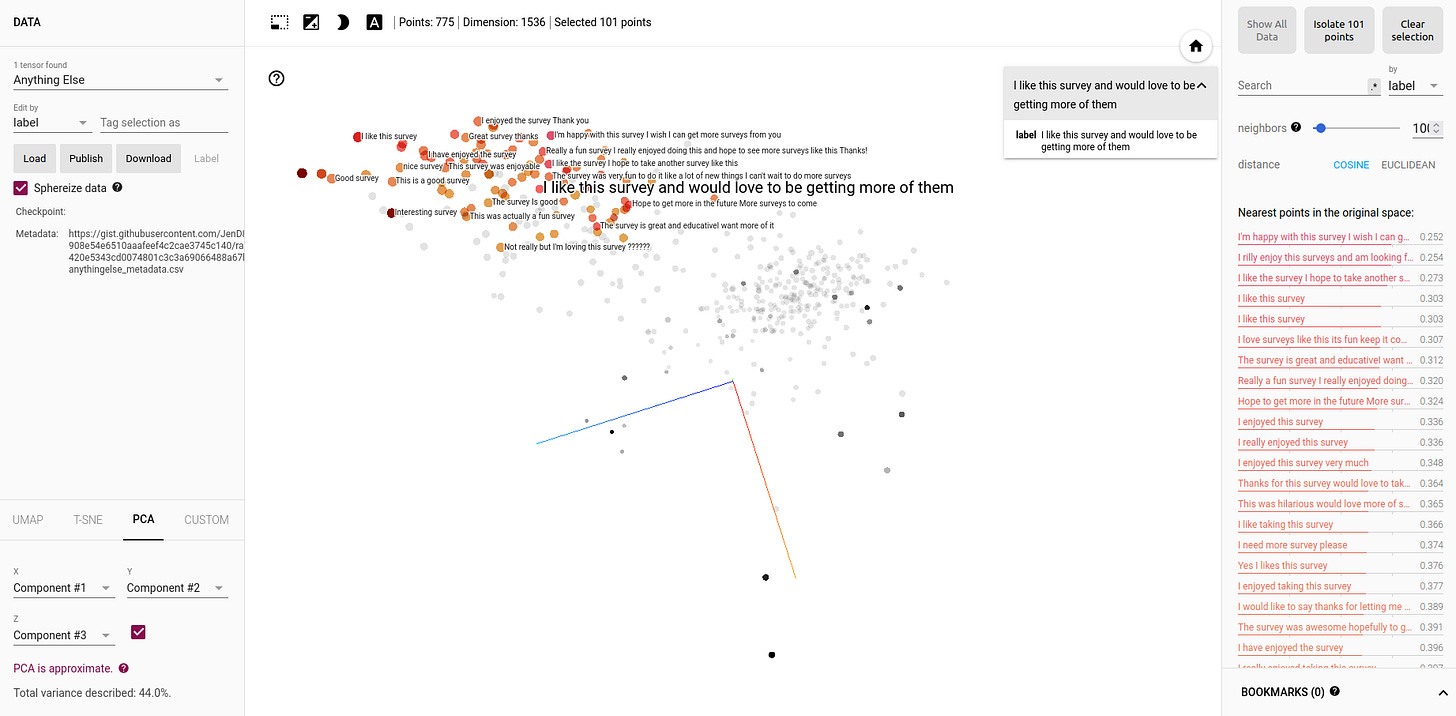
As a final question, we gave respondents a box to write in as the spirit moved them. This was by far my favourite question for reasons specific to the polling industry. A lot of industry practitioners treat survey respondents with contempt; in most cases the goal of a poll is not to find out their actual opinions, but to manipulate them into providing the desired answer through poorly-designed questions.
This creates a self-perpetuating cycle, in which investigators, having been schooled by previous poorly written questionnaires, believe respondents to be idiots and overestimate their own intelligence, and so over-write future surveys to provide ever more (and ever sillier) guides and guardrails. Thus the responses get stupider and more interventionist questioning methods are adopted.
Whenever I can I try not to do this, using open-ended questions where possible, despite being told by almost everyone in the sector that this is a waste of time and money. I and have always found that if you give people the chance they almost always give clever, funny and well-reasoned answers. It is thus nice to see that they appreciate well-written surveys that genuinely respect their opinions.
What’s next?
Next time around I would like to try something slightly different. For this purpose I am looking for people interested in receiving advice about one of their problems from several hundred online strangers, and willing to give an email (anonymous fine) that I can use to follow up on the advice received and its consequences a few months later.
Please share your problems/email here: https://docs.google.com/forms/d/e/1FAIpQLSeoJlptDZXeP8yUmfGcHFNg5s9MGnG7Oow1PqlqGMrSI4Q8IQ/viewform?usp=sharing
Edit to change the venting section: I re-checked and realised I accidentally inverted one set of values twice, producing the opposite of the correct outcome.


